
Sales Dashboard (Profit & Revenue)
Bafflesol Technologies · Marketing & Sales
Certification per Microsoft Marketplace.
Evidence tier Source Confirmed · 7 captures on record
What the publisher says
As described on Microsoft Marketplace.
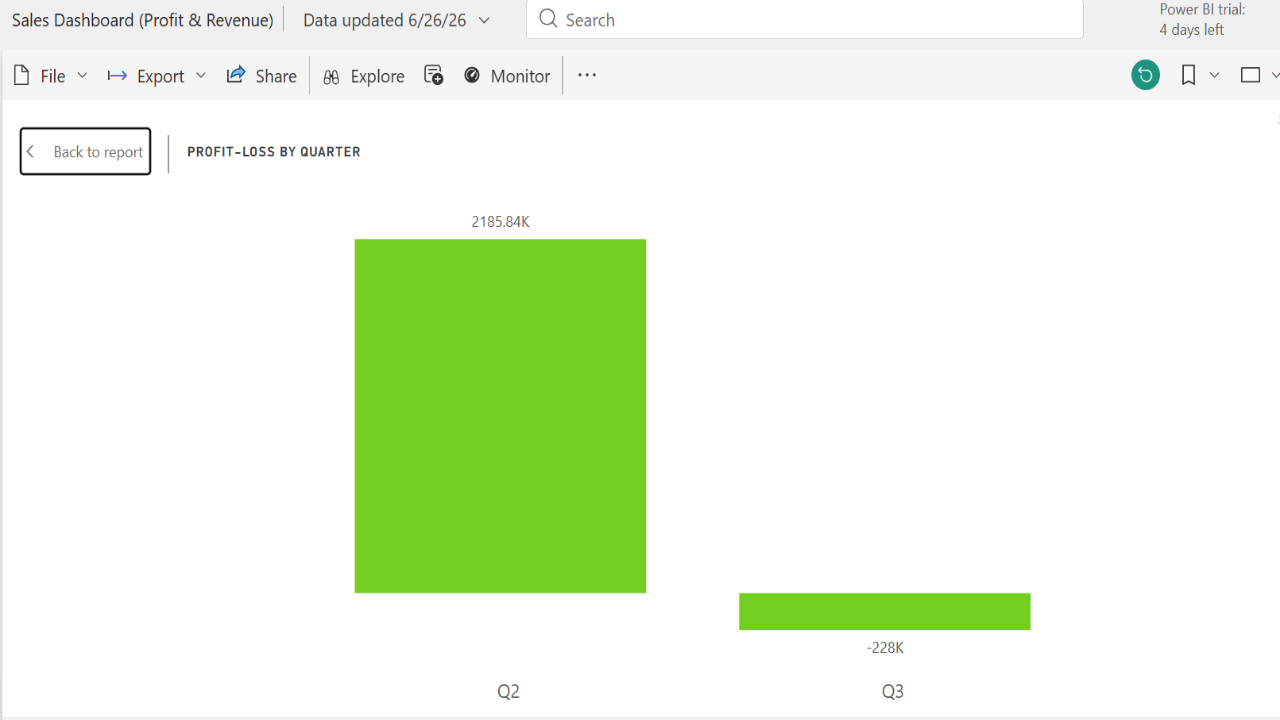
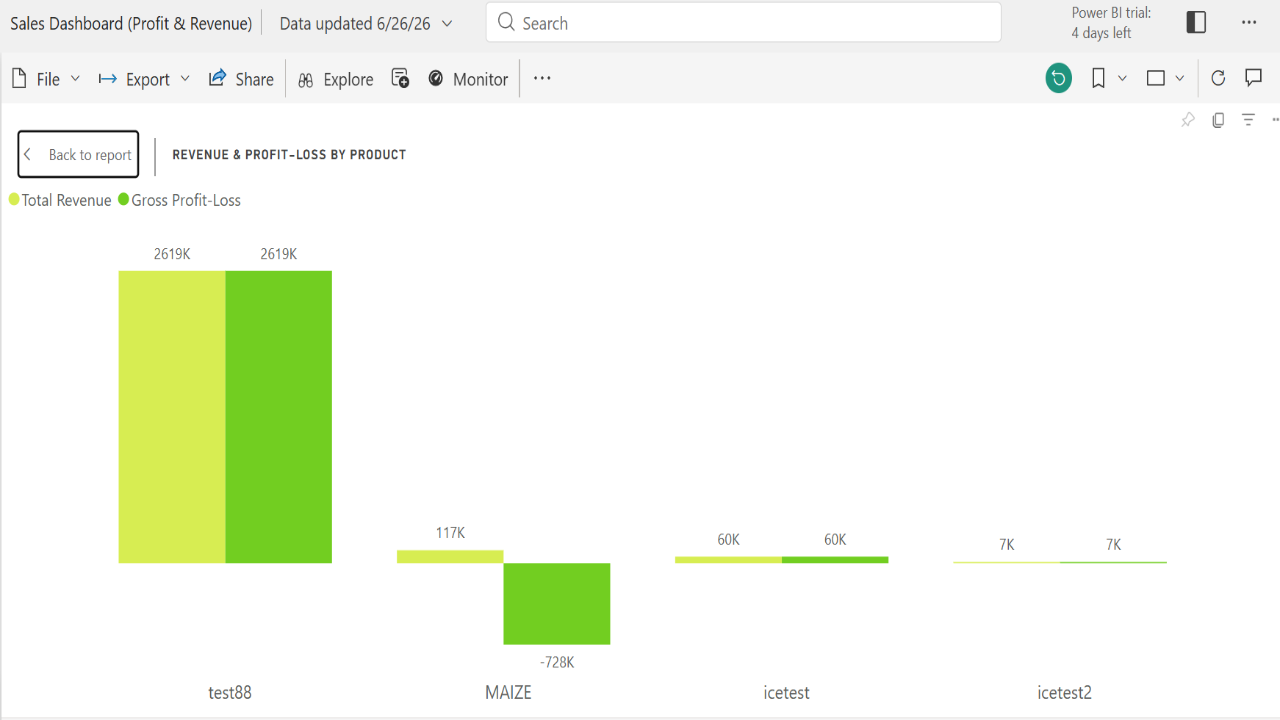
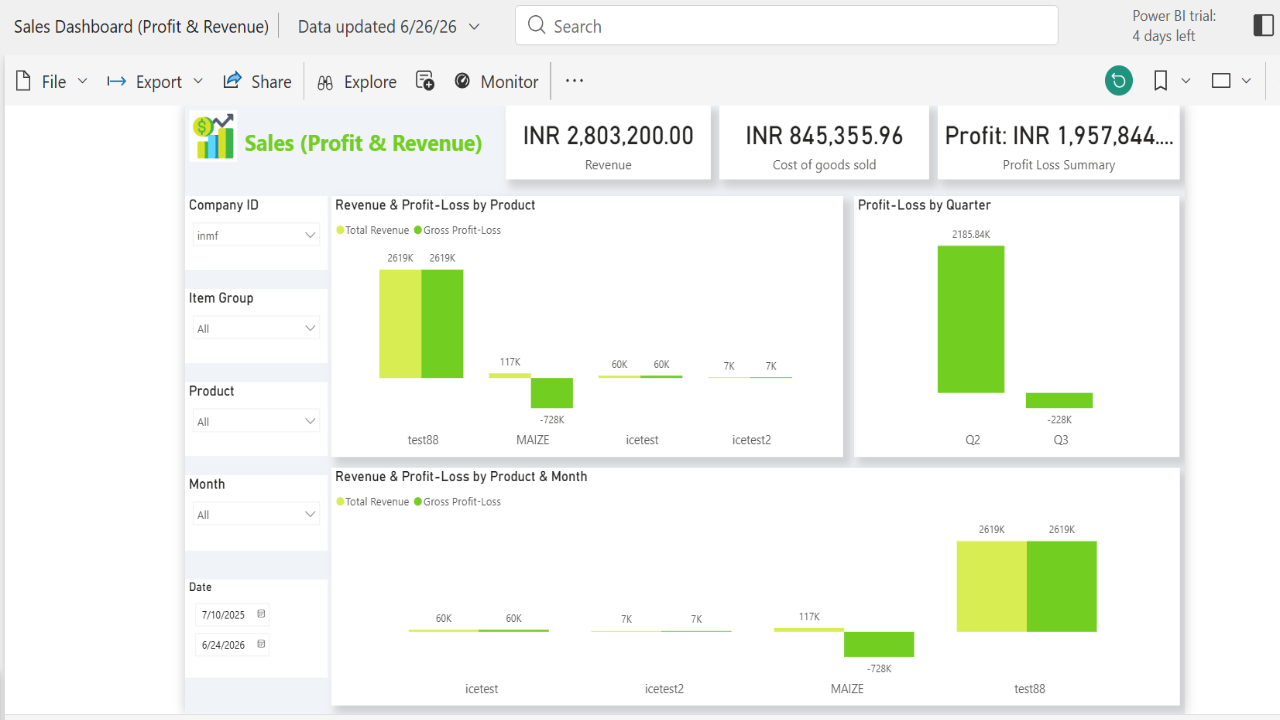
Sales Dashboard (Profit & Revenue) is a comprehensive business intelligence solution built on Microsoft Power BI to help organizations gain deeper insights into their sales and financial performance. This dashboard consolidates sales and financial data into a single, interactive platform, enabling business users, finance teams, and management to monitor revenue, profitability, and cost trends in real time. The solution provides an executive overview of key performance indicators, including Total Revenue, Cost of Goods Sold (COGS), and Profit/Loss Summary, allowing stakeholders to quickly assess business performance. Advanced visualizations enable users to analyze Revenue and Profit/Loss by Product, Quarter, and Month, helping identify top-performing products, loss-making items, and seasonal trends. The dashboard is integrated with Microsoft Dynamics 365 Finance & Operations (D365 F&O) providing a centralized reporting solution that reduces manual reporting efforts and improves operational efficiency. The key interactive features include: 1. Dynamic filtering and slicers for Company, Item Group, Product, Month, and Date Range, 2. Product-wise profitability analysis to identify high-margin and low-performing products, 3. Quarterly and monthly trend analysis for revenue and profit performance, 4. Cross-filtering and drill-down capabilities for detailed financial exploration & 5. Real-time insights and interactive reporting to support strategic decision-making
Key Benefits
Show the rest of the publisher’s description (3 more lines)
The key benefits of the Sales Dashboard (Profit & Revenue) are follows: 1. Real-Time Sales Performance Monitoring, 2. Comprehensive Profitability Analysis, 3. Improved Financial Decision-Making, 4. Trend Analysis and Forecasting, 5. Interactive Data Exploration, 6. Early Identification of Financial Risks, 7. Enhanced Operational Efficiency, 8. Better Product Performance Management, 9. Executive-Level KPI Visibility, 10. Seamless Integration with D365 Finance & Operations, 11. Data-Driven Strategic Planning & 12. Improved Business Profitability.
Features
- Dynamic filtering and slicers, 2. Product-wise profitability analysis, 3. Quarterly and monthly trend analysis, 4. Cross-filtering and drill-down capabilities & 5. Real-time insights and interactive reporting.
Preview
4 images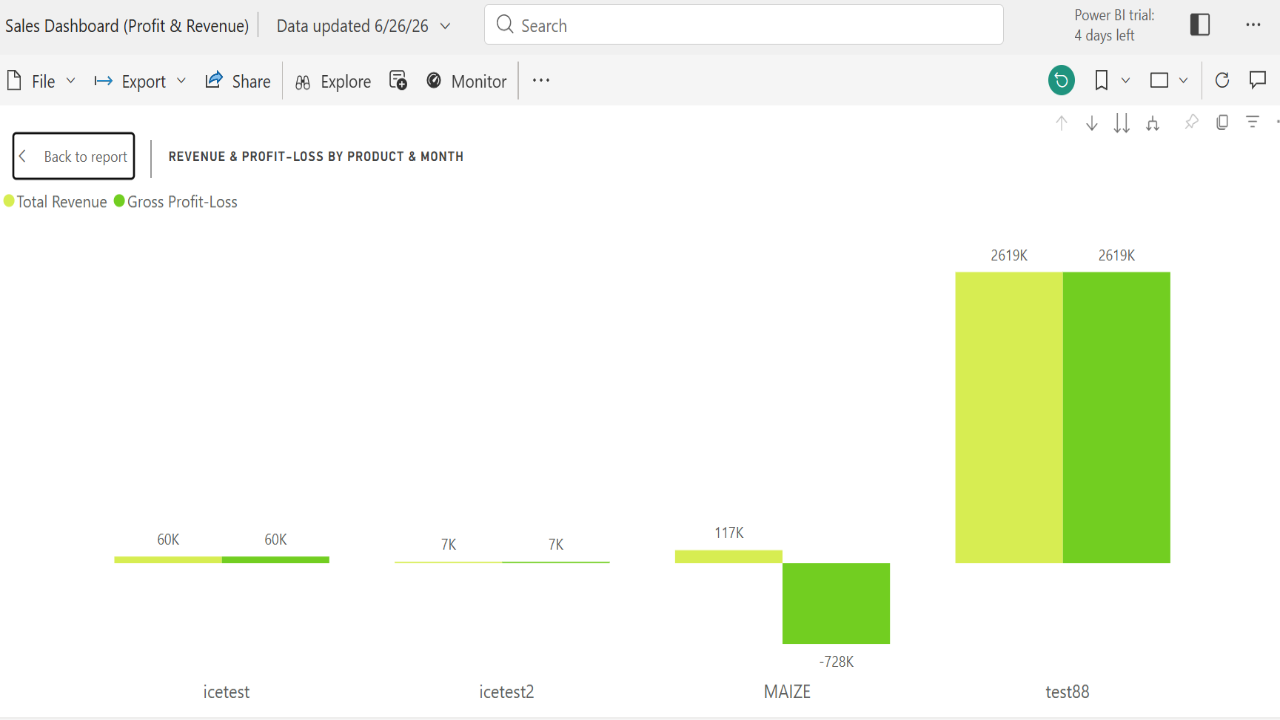
Agent build and provenance
See the full provenance
The layer-by-layer build, the evidence behind each claim, the risk basis and the cross-marketplace links are open to any account. Some rows are disclosed, some the source leaves Unknown; a free account shows you which.
Compliance
- FedRAMPConfirmedNot listed90%, registry-checkedNo FedRAMP Marketplace entry matched this vendor's domain, checked 2026-08-27registry recordas observed 2026-08-27
Confirmed means matched to a public authoritative registry. Claimed means the vendor or its listing states it, not yet cross-checked. A framework not shown was not found in any source we hold, which is not evidence against it. Not listed means a scoped registry check found no match for this vendor's domain: a No is a scoped registry check, not a compliance judgment. Confidence bands: 95% domain-verified, 90% registry-checked, 80% self-attested, 70% weak signal. Self-attested items marked “vendor's site” are gathered from the vendor's own website and are not verified by us.
Vendor
External enrichment
Sources
Publisher resources
2 linksLinked repositories
Unknown means this listing does not publish a repository. It is not a statement that the code is closed, and a linked repository is not a claim that the publisher wrote it: the registry computes that relationship privately and does not publish it.
Evidence risk is the share of the build you cannot see before you deploy, not a security rating. Sign in to see the layer-by-layer basis for this band.